OECD
By 2060, we anticipate that global plastic consumption will have quadrupled to more than 1,200 million tonnes. Of this, more than 90 Mt (7.5%) will enter the natural environment: onto land (26 Mt); into water (18 Mt); or into the atmosphere after being burned in open uncontrolled fires (48 Mt).
We were proud to support the OECD with the extension of the capabilities of the ENV-Linkages model. A top down, input-output model which, for the first time, maps the flow of all the world's plastic throughout the system, from production, through it use and after use fate, linking it to macro-economics. In this project, we used the powerful SPOT model to map the flow of mismanaged plastic waste to determine the mass stored, emitted and transported through the terrestrial compartment.
We were also able to provide unique insight into the amount of waste collected for recycling by the informal waste sector, helping to understand the extent of the recycling systems in the Global South.
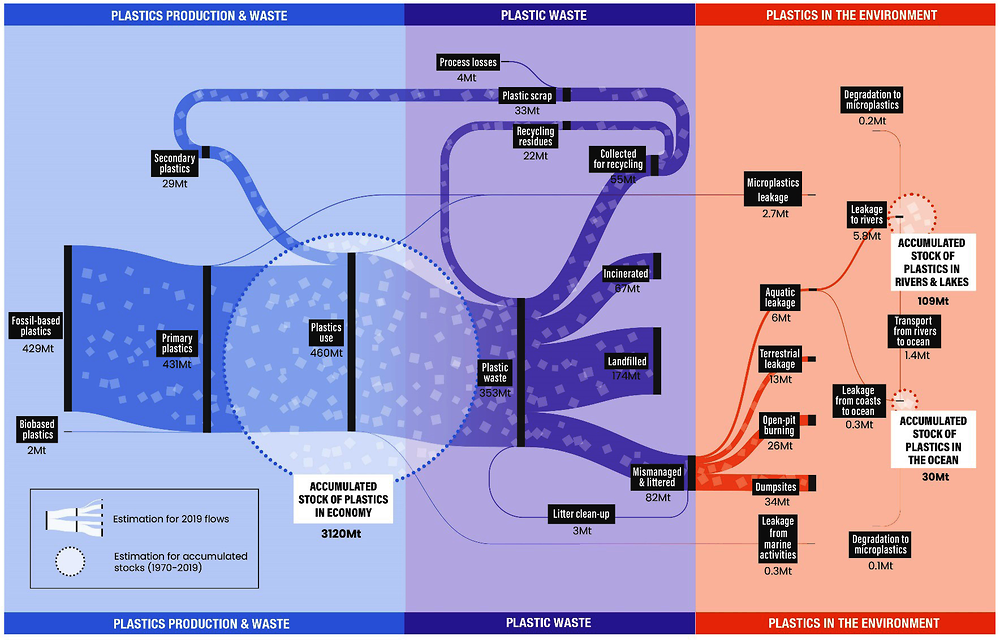
Global Plastic Flow 2019 in millions of metric tonnes (Mt) (Global Plastic Outlook 2022). Image courtesy of OECD.
But, to truly understand how our plastics recycling system works, we need to assess the variance between the amount of waste collected for recycling and the amount manufactured. Until now, 'losses' from plastic waste sorting and reprocessing have been a source of tremendous uncertainty, as Ed Cook, Research Fellow at the Leeds team explains:
We are just starting to understand how much plastic waste is collected for recycling worldwide, but it's a much greater challenge to estimate how much of that material makes it to the manufacturing phase. Working on this project with the OECD team brought us another step closer to finding out this critical information, enabling us to improve our estimates of how much waste is mismanaged worldwide
Based on the findings of the ENV-Linkages model, we were able to project our baseline across multiple future scenarios to assess the likely impact of government interventions on the amount of waste emitted into the environment through different pathways.
We used SPOT model capabilities to contribute to the baseline plastic waste across the managed and mismanaged systems in the OECD ENV-Linkages Model. The SPOT model uses waste management data measured at municipal level to train a machine learning model (quantile regression random forest) that can predict data for municipalities where no information exists.
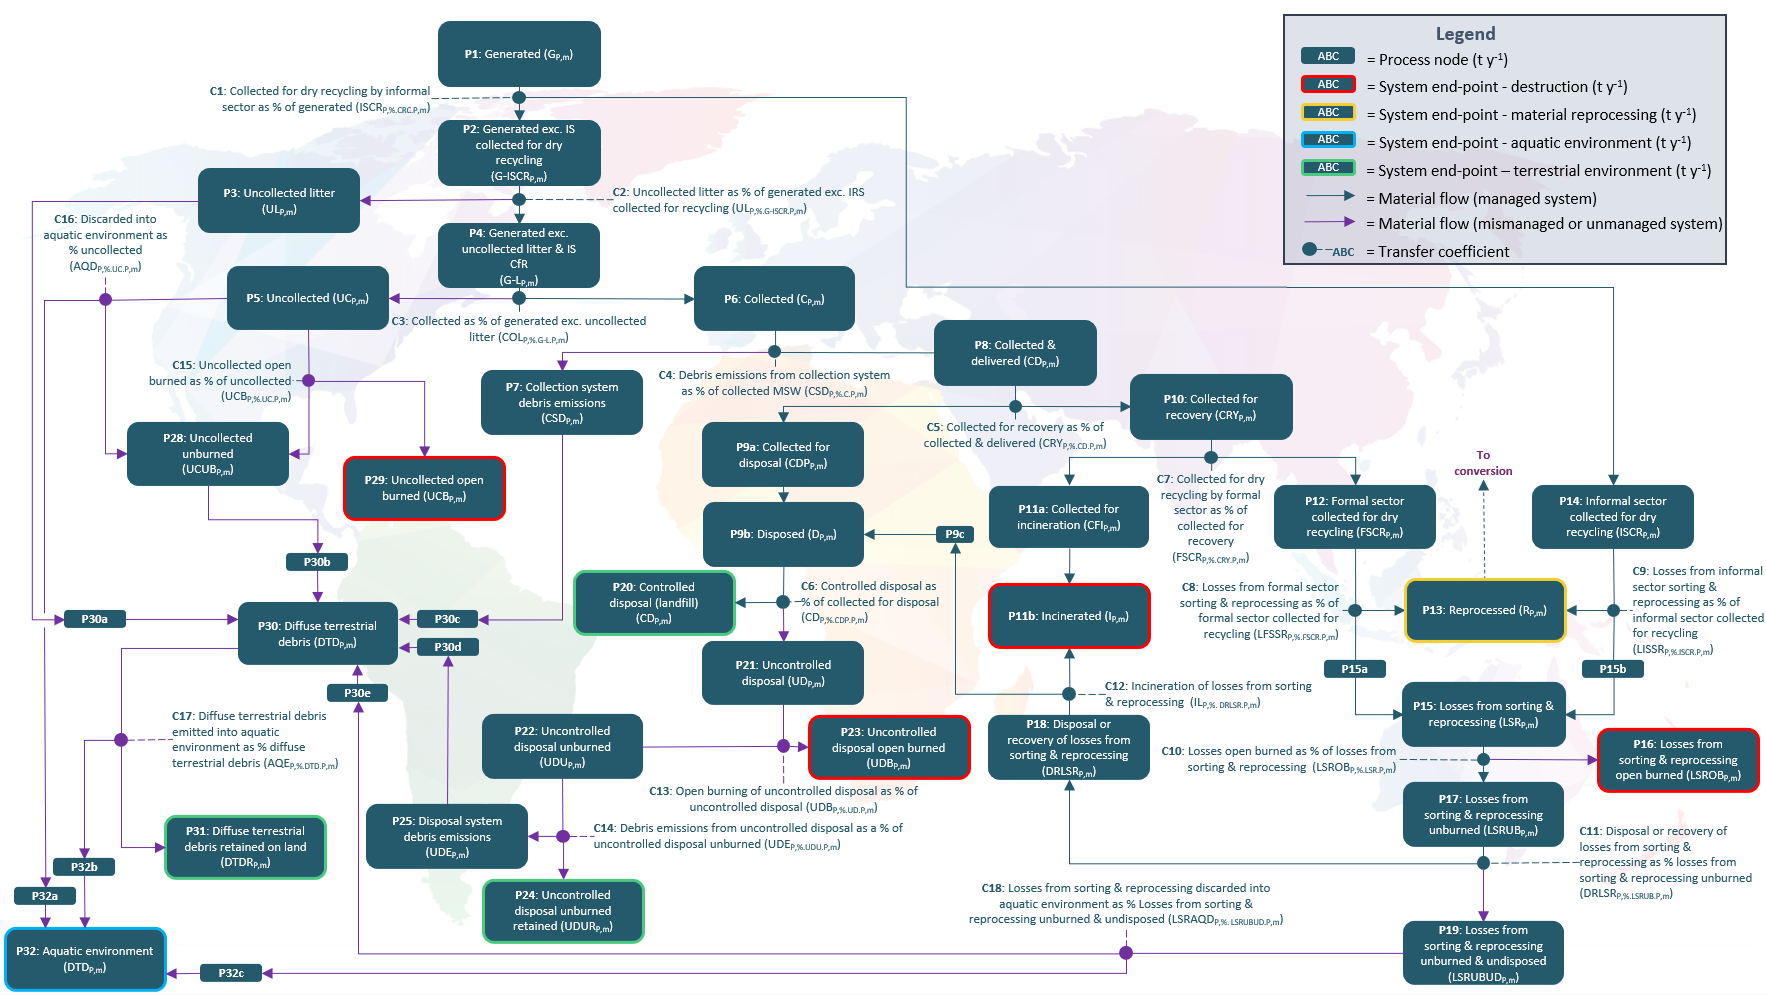
Structure of the ENV-SPOT plugin
Dr Costas Velis, Principal Investigator for the Leeds team elaborates:
Many waste management flows are not routinely or ever measured. To approximate these flows, we created a series of novel sub-models using activity data and abductive reasoning - a major breakthrough in conceptualising and quantifying core aspects of plastic pollution.
For example, the activities of the informal recycling sector are challenging to measure as its participants have little reason to keep and publish records of their day-to-day business. We use studies of the number of waste pickers operating in different contexts along with their typical productivity to estimate the amount of plastic waste collected for recycling in different regions. We developed a sub-model to approximate the amount of material which is rejected during sorting and reprocessing operations. We assessed the probability of rejection based on the relative abundance, technical and monetary value in different contexts.
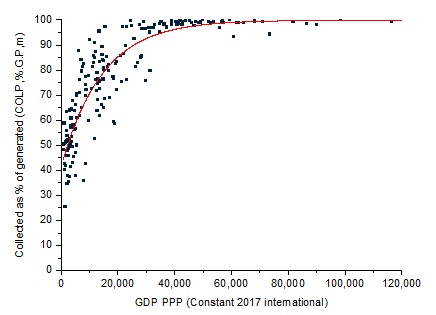
Exponential decay model in which variability in collection rate (COLP,%.G.P,m) as modelled by the Spatiotemporal Quantification of Plastic Pollution Origins and Transportation (SPOT) model (Cottom et al., 2022) is explained by GDP PPP per capita (constant 2017 international).
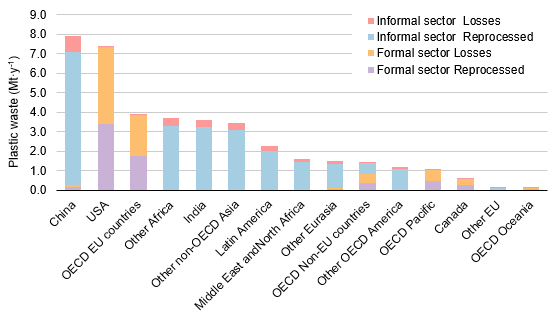
As shown in the chart above, losses from the recycling system are substantially lower in regions of the Global South, where the majority of plastic waste collected for recycling is handled by the informal waste sector.
Another system flow with largely unknown attributes is uncollected litter. Data on collected litter are well documented, but it is extremely challenging to estimate how much waste is uncollected. To address this uncertainty, we have developed 'sub-models' which derive the rates of uncollected litter from a combination of uncollected waste and street sweeping efficiency. This enables us to approximate the necessary data according to the GDP of a given country.
![]()
The outputs of the OECD work are publically available in the relevant Global Plastics Outlook web-portal.