The Science Behind....
SPOT is a plastic pollution inventory which comprises two main components
A: Probabilistic material flow analysis for plastic emissions
B: Temporal geospatial modelling for plastic movement
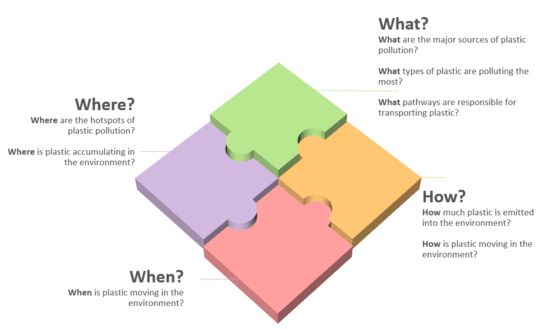
The model answers fundamental questions which can assist with baselining, measuring and monitoring progress towards targets set by the Global Treaty on Plastic Pollution and SDG11.6.1.
Part A
Municipal level waste management activity data are used to train a quantile regression random forest machine learning model. Using socio-economic indicators, SPOT predicts data for municipalities where data are insufficiently robust or non-existent.

Four global and two national datasets were used to train the quantile regression random forest model
Primary input data were sourced from four international and two key national datasets and intensively cleaned and harmonized to a consistent basis. Approximately 2,000 municipal data records have been assessed for plausibility and robustness, with attention to which part of the system they were measured at. Where necessary, data were discarded or where possible 'corrected'.
Unrecorded, unmeasured or neglected flows within the complex system were approximated using comparable data. We also developed a series of sub-models which combine related activity data with abductive reasoning to approximate flows. Emissions are estimated by assessing the probability of escape from societal and management systems on the basis of material type (flexible and rigid format), waste management quality and service provision, and behavioural characteristics of the populous.
These data, together with those predicted by the machine learning are assigned a probability distribution from which 5,000 samples are drawn as part of a probabilistic material flow analysis using Monte Carlo simulation.
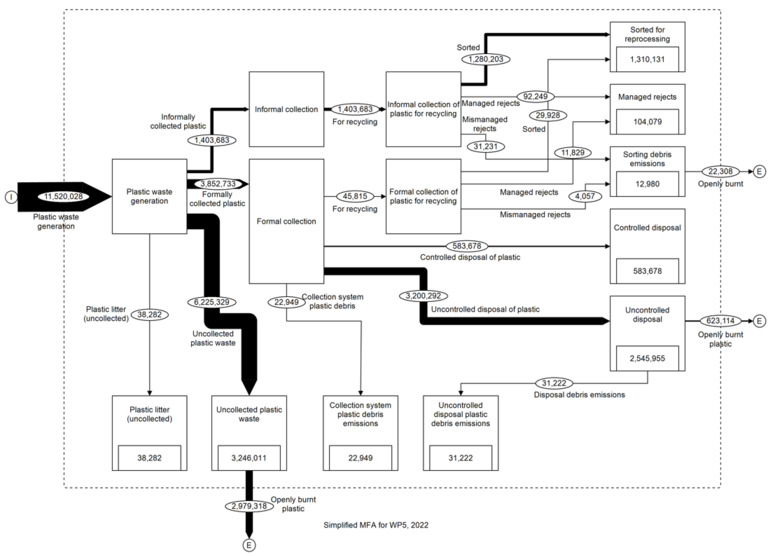
Simplified material flow analysis model of plastic waste in Indonesia as generated by SPOT
Plastic waste flows are illustrated using geographical information systems (GIS) which can show highly granular data to enable identification of areas where waste management or mismanagement are most prevalent and where resources could be allocated most efficiently. Alternatively, the outputs of the model can be aggregated to any scale, such as state, province country or regional level. The flexibility of these outputs enables SPOT to be used for baselining, monitoring and reporting to support local or national action plans.
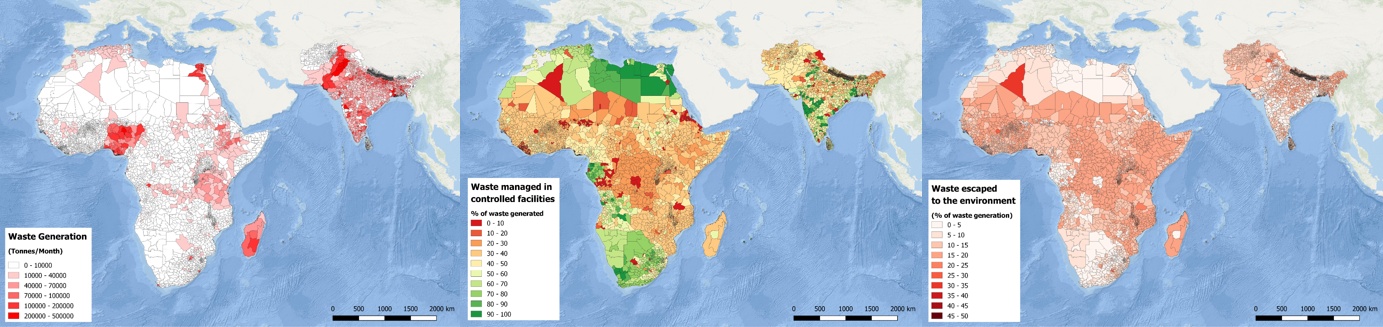
Different outputs of the SPOT emissions inventory are illustrated using GIS mapping software
PART B
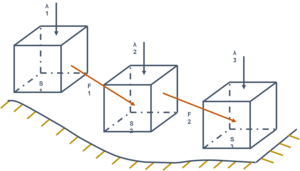
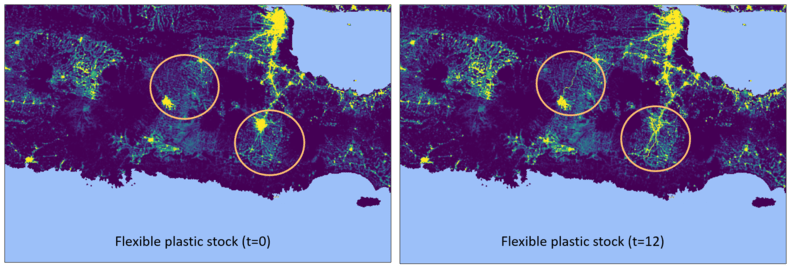
Digital elevation mapping enables SPOT to determine the direction of flow for plastic debris
Once the emissions from mismanaged and mismanaged systems have been quantified, SPOT tracks plastic movement across the terrestrial environment with an R-GIS based dynamic geospatial model. Plastic movement is determined across monthly timesteps at raster square resolution (0.2 km²).
Digital elevation maps are used to understand the direction of movement within each of the world's river basins. This means we are able to identify the point of release into rivers and oceans and points of accumulation on land.
Plastic debris is classified as either rigid or flexible which assist with determining the probability of movement from one cell to another.
Validation
The SPOT model is undergoing field validation in Indonesia as part of the ongoing PISCES partnership. Early results indicate that SPOT is predicting hot and coldspots of plastic pollution with high rate of success. we are proud to have collaborated with the University of Plymouth and Institut Teknologie Bandung (ITB) who are collecting data in the field to validate our model.
Open source data
The University of Leeds is committed to running a global version of SPOT every 6 months, incorporating new data and developments. Once published, we will release the code used to run the model and all associated data. Results will be freely available on the GPML data hub platform.