Waste Flow Diagram - WFD
Download the WFD Toolkit Download the WFD User Manual
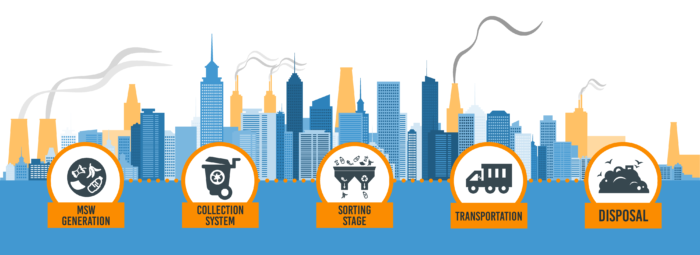
As the world’s population nears 8 billion, so to our waste grows. Increase in consumption combined with rapid urbanisation, particularly in low- and middle-income countries, has put our cities at the forefront of dealing with the huge quantities of waste produced every day.
This global challenge, so frequently overlooked, has far reaching impacts tied to both human health and the environment, as recognised by its inclusion in many of the sustainable development goals (SDGs). Unfortunately, without improved knowledge on the waste flows within our cities, action cannot be taken to ensure sustainable solid waste management practices and avoid the damaging consequences of its mismanagement such as marine litter. The Waste Flow Diagram (WFD) toolkit enables cities and municipalities to quickly assess their municipal solid waste management system and map the flows of waste, thereby aiding in solving this critical issue.
The Waste Flow Diagram (WFD) toolkit enables cities and municipalities to quickly assess their municipal solid waste management system and map the flows of waste.
In short, the WFD aims to:
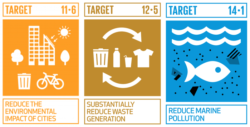
- Provide a rapid assessment of a cities or municipalities municipal solid waste management system and visualise the flows of waste, including informing the SDG 11.6.1 sub-indicators
- Use observational based assessments to quantify the sources of plastic leakage into the environment and determine the fate of this uncontrolled waste
- Identify high-priority sources of plastic pollution
- Allow benchmarking and comparison between cities
- Run scenarios to gain insights into how proposed interventions may impact the solid waste management system and plastic pollution
- Quantify the effectiveness of applied interventions
With a solid waste management focus, the WFD directly integrates with the SDG 11.6.1 methodology to inform on the performance of a cities SWM system. Using a rapid, observational based assessment, the WFD also estimates plastic leakages to the environment to provide comparative indicators of plastic pollution. All waste flows are summarised in easy to visualise Sankey diagrams.
